85 days without appreciable rain in Barcelona, on the way to an exceptional drought.
2015 was the driest year on record since 1878, and we currently exceed 85 days in a row without raining 1mm / lm2
For the majority of meteorological observers consulted from Raig, the most notable meteorological news is the absence of precipitation. Last 2015 was the driest year on record in Barcelona city since 1878, in a climatic series that began in 1786. The Observatori Fabra collected 345.2mm and the one in the Sant Andreu neighborhood 341.6mm. The annual average of precipitation in Barcelona is between 580 and 620mm.
Multisecular pluviometric series of Barcelona 1876-2015
Link to image 1: Barcelona multi-century pluviometric series: 1876-2015
Link to image 2: Map of the total annual precipitation collected in Barcelona in 2015.

Not only was 2015 a dry year, we have to go back to December 2011, when the rain gauges in Barcelona and most towns and cities in Catalonia did not see a drop fall. It was followed by a very dry and windy 2012, a 2013 and 2014 with very irregular rain, of a tempestuous nature and especially concentrated in interior and mountain places.
Only an extraordinary 2015 was missing to finish off a period of 50 months that leaves us with a deficit of -580.6mm in the city of Barcelona.
Monthly precipitation anomaly 2011-2015
Link to image 3: Monthly precipitation anomaly at the Barcelona-Sant Andreu observatory.
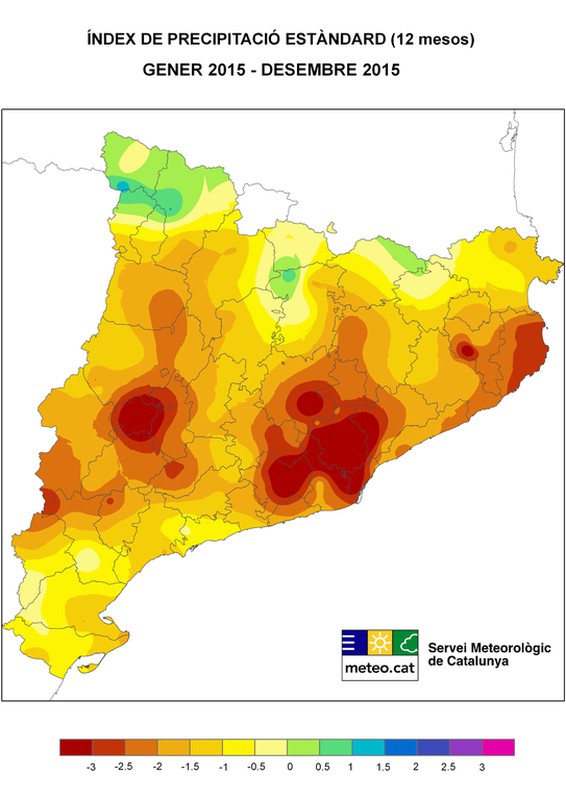
The data is overwhelming and from there we can produce climatic products that indicate the state of the drought. One of them is the IPE or standardized precipitation index, which indicates the degree of positive or negative precipitation anomaly with respect to a long and reliable climatic series. From -1 it is considered a period of moderate drought and from -2.5 of extreme drought.
Currently, the Barcelona metropolitan area presents IPE values between -2.5 and -3.5 in the 12-month period, therefore we are experiencing an extraordinary drought situation.
Map IPE Catalunya Jan-Dec 2015 Link to image 4: IPE in Catalonia, January-December 2015. Source: Meteocat.
On November 3, 2015, 15mm fell in Barcelona, since then the tap was closed and it has not rained again in conditions. The 85 days are exceeded without falling 1mm l / m2, a historical record at the climatic level in Barcelona and surrounding cities such as Sant Cugat del Vallès.
The previous dry streak dated from 1928, specifically between May 22 and August 14, 1928. Then, at the prestigious Fabra Observatory, 85 consecutive days were achieved without raining appreciably, now we have already passed it.
Maximum duration of the dry streak in Catalonia (1mm)
Link to image 5: Maximum duration of the current dry streak in Catalonia. Source: Meteocat
In the last 10 years, these 1mm dry streaks had not exceeded 70 days, between November 2011 and February 2012 it lasted 66 days, according to the Badalona observatory.
Dry streaks of the last 10 years in Badalona
Link to image 6: Dry streaks 2005-2015 in Badalona. Source: Oriol Rodríguez.
The long-term weather forecast has been refined in recent years, and periods such as the current one serve to validate these predictions at 1.2 or 3 months ahead.
NOAA, the American climate agency, is responsible for developing these prediction products, mostly based on initial conditions and the possible evolution of the action centers, anticyclones and storms.
The forecast for the coming months predicts the continuation of the drought, with a very dry February, a slightly less rainy March, and an April again scarce. The effects of a dry spring can be very serious in the vegetation, which already carries a very significant water stress.
Precipitation anomaly predicted February-April 2016.
Link to image 7: Seasonal forecast of rainfall anomaly, Feb-April 2016 Source: NCEP-NOAA
Other related articles
 March 16, 2020
Raig in the face of the Covid-19 Coronavirus crisis
How does Raig deal with this crisis? What does it mean for … Feb. 29, 2020
The weight of the binoculars, a key factor.
The weight of the binoculars is a primary factor in choosing a … Nov. 2, 2019
Photo-trapping cameras
What is a phototrapping camera and what is it used for? What … Oct. 26, 2019
Problems and errors in rain measurement
In torrential weather episodes, we often find differences between analog and manual … Oct. 5, 2019
Opinions of our clients
Receive our news