Data management in automatic weather stations
Archiving, visualization and management of the data of the meteorological variables obtained by an automatic meteorological station.

A meteorological station is a machine to record data , now we need an order in the face of so many whirlwinds of numbers and variables, to build a file or a climatic series if we already have a sufficiently important number of years.
The meteorological stations or EMA'S record data every certain time interval, depending on the model and characteristics of the station, these data are the instantaneous ones, which we see on the screen or console. On a given day we can obtain the maximum or extreme data, the means or the means in a certain time interval. All of this data is stored on an internal or external device called a datalogger .
The device that is in charge of storing the data that an automatic meteorological station collects is the datalogger , this device keeps the data at a time frequency, normally, programmable. The storage frequency is directly related to the storage capacity. Therefore at a smaller frequency, more stored data and faster memory saturation.
With this device we have the comfort of being able to be away from our home and not suffer from losing the meteorological data, so valuable to our climate archive.
But of course, the data there in a "box" does nothing, if we take meteorological data it is for some interest, if only to find out if we can water the plants or hang clothes on the balcony. Well, if we are interested enough to be meteorological observers , then we have to take or export this data to a destination far from that "box" of emergency that is the datalogger. Normally, this export is done to a computer or directly to the network.
The export is carried out through 3 possible formats or supports:
1- Serial connection, via RS232 cable, between datalogger and computer.
2- USB connection, via USB cable between datalogger and computer.
3- IP or network connection, between the datalogger and the router.
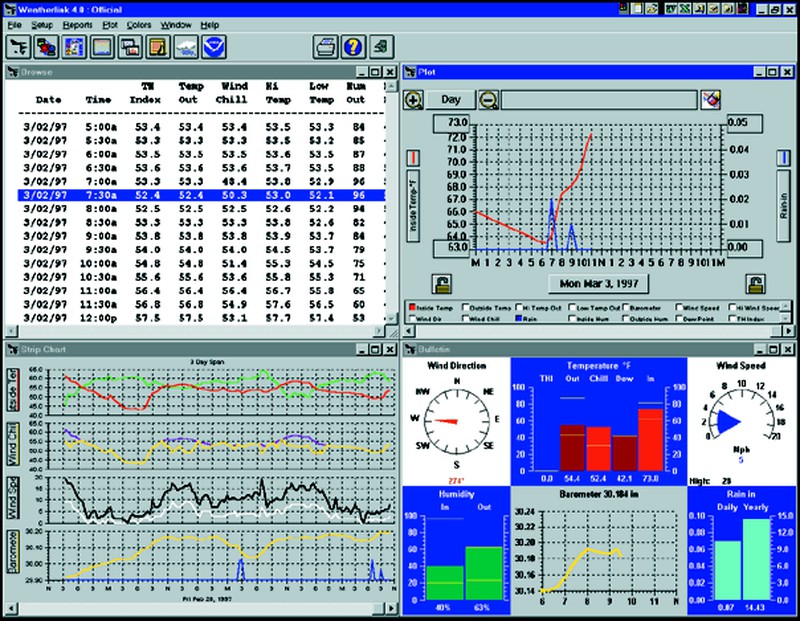
The next step that will allow us to visualize the data will be the installation of a computer program , there are many programs for this purpose, which allow us to see the data in numerical format, in graphic format, obtain daily, annual and monthly climate summaries , export these data to excel or csv files and finally to "hang" the data provided by our station, to the web.
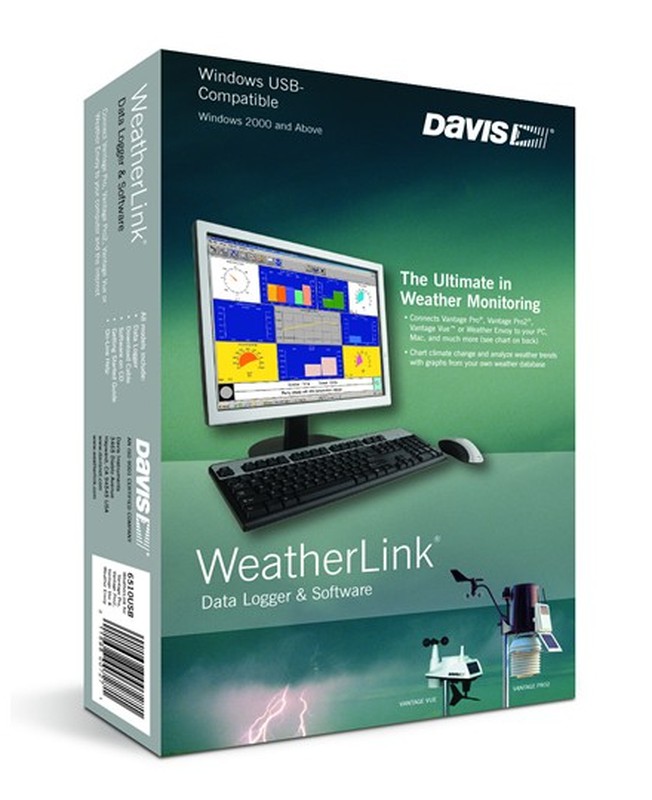
Among all these programs or computer supports we can highlight: Weatherlink, WeatherSnoop, WeatherCloud, VirtualWeatherStation, WeatherDisplay, etc ... The purpose of all of them is common, although there are variations in the design and format for displaying data and graphics.
This is one of the most important steps in the entire process that we are detailing. The purpose of all the registration, storage and export of data is to be able to build a climatic series of our observatory.
A climatic series is made up of all those data collected over a period of 30 years, in the same physical or geographical location. Among the variables represented, we highlight Temperature, precipitation, relative humidity, atmospheric pressure, wind speed and direction and also solar radiation . There are also other observation parameters not provided by the automatic meteorological station and which require the figure of the observer. These parameters can be, cloud cover, visibility, the state of the sea or different meteors, such as snow, hail or optical phenomena .
Once we have all these data, we can come to characterize the climate of our area or municipality. This characterization is carried out using graphs, climograms or summaries of extreme or average values.


Opinions of our clients
Receive our news